Financial Strategy
COGS Percentage: Specialty vs General Practice
COGS Percentage: Specialty vs General Practice: ADA HPI benchmark data and what it means for your practice.
Financial Strategy
COGS Percentage: Specialty vs General Practice: ADA HPI benchmark data and what it means for your practice.
Financial Strategy
Dental Practice Overhead by State 2026: ADA HPI benchmark data and what it means for your practice.
Practice Management
A productive dental operatory generates $200,000 to $350,000 in collected revenue per year, averaged across every equipped chair in the practice, hygiene included. Below $150,000 per chair, something specific is broken: scheduling, fees, or write-offs. The math Annual collections divided by equipped operatories. A $1M practice with
Financial Strategy
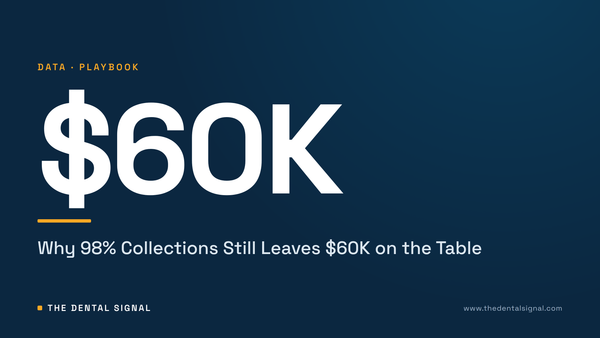
The benchmark: a well-run practice collects 98% or more of net production. Between 96% and 98% you're leaving real money on the table. Below 96%, you have a systems problem, not a patient problem. Measure against net, not gross Collections divided by gross production is a nearly useless
Financial Strategy
Most associate buy-ins sell a 20% to 49% stake in the first tranche, with a path to 50/50 or full succession written into the agreement. The structure matters more than the headline percentage. Here's how the pieces usually fit. Valuation basis Two common methods: a percentage of
Financial Strategy
Your insurance aging report is the fastest read on whether your billing is healthy or quietly bleeding. Most PMS systems bucket outstanding claims into 0-30, 31-60, 61-90, and 90+ days. Here's what good looks like in each bucket, and what to do when yours doesn't match.
Financial Strategy
Every PPO exit conversation starts with the same fear: "I'll lose 30% of my patients and my collections will crater." Here's what the numbers actually look like when practices drop a plan, and why the collections math is usually better than the fear. Start
Financial Strategy
Ask most practice owners what their PPO reimbursement rate is and you'll get a shrug or a guess. That guess is usually high. If you don't know the real number per plan, you're negotiating blind and probably subsidizing your worst contracts with your best
Financial Strategy
Your write-off percentage is the share of your fee schedule you give away to stay in network. Most PPO-heavy practices run 20-35%. Past 40%, you're working Fridays for the insurance company. How to calculate it Pull gross production at your full fee schedule and total contractual adjustments for
Practice Management
Most dental practice sales in 2026 are bank-funded. Practice lenders will finance 100% of a healthy practice's purchase price, which is why full seller financing is rare. Where seller financing actually shows up is as a partial note: the seller carries 10% to 30% of the price, and
Practice Management
Buying a dental practice is probably the largest check you'll ever write. Most deals in 2026 are closing between $500K and $1.2M for a solo GP office, and the difference between a good buy and a five-year headache usually comes down to what you verify in the
Practice Management
The headline number a DSO quotes you is not what shows up at closing. A typical deal pays 60 to 80 percent in cash at close, with the remaining 20 to 40 percent split between an earnout and rollover equity. The earnout is the part most sellers understand least, and